Debugging BL702
You may use the advertised Sipeed RV-Debugger Plus. It emulates a dual device one for the flashing (UART) and for JTAG.
Then hookup the probe according to the following pinouts on the BL702:
| BL702 Pin | JTAG Function |
|---|---|
| D0 | TMS |
| D1 | TDI |
| D2 | TCK |
| D9 | TDO |
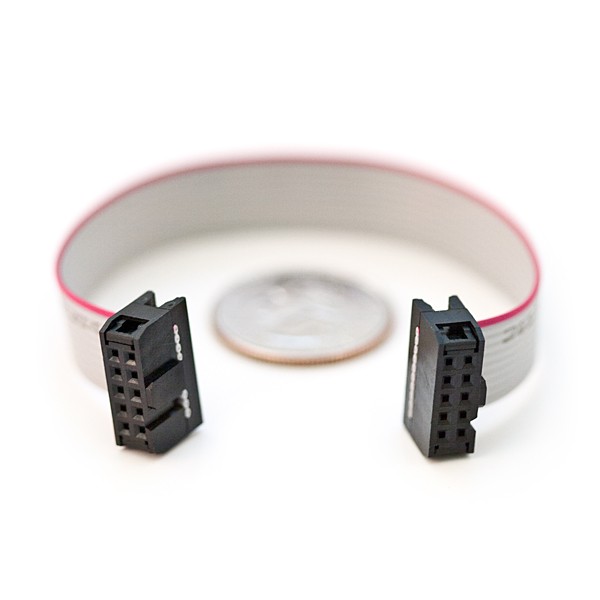
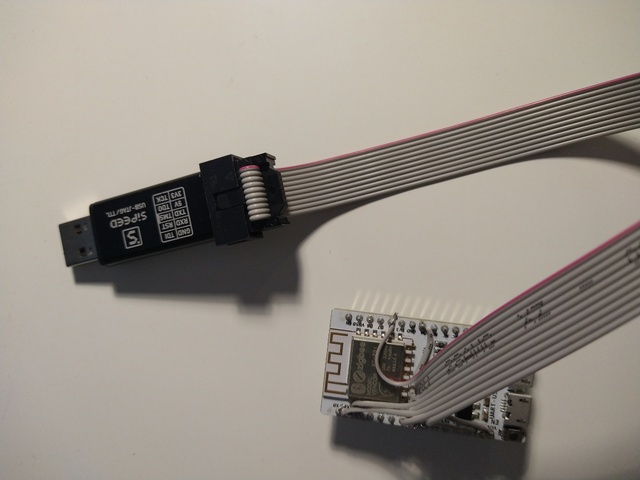
You may ofcourse simply plug it with breadboard dupont wires. But I found it convenient to use one of these 2x5 IDC ribbon cables:
and solder them on straight to the board like this:
Once the hardware is setup, place the following files in the ~/openocd-cfg/ directory:
In if_rv_dbg_plus.cfg:
# BouffaloLab USB-JTAG/TTL adapter
adapter driver ftdi
ftdi_vid_pid 0x0403 0x6010

ftdi_channel 0
#ftdi_tdo_sample_edge falling
transport select jtag
adapter speed     4000

ftdi_layout_init 0x00f8 0x00fb
#ftdi_layout_signal nTRST -data 0x0400
#ftdi_layout_signal nSRST -ndata 0x0020

#reset_config srst_only srst_push_pull
#adapter_nsrst_delay 100
#adapter_nsrst_assert_width 100
In tgt_702.cfg:
#target chip

set _CHIPNAME riscv
jtag newtap $_CHIPNAME cpu -irlen 5 -expected-id 0x20000e05

set _TARGETNAME $_CHIPNAME.cpu
target create $_TARGETNAME.0 riscv -chain-position $_TARGETNAME
$_TARGETNAME.0 configure -work-area-phys 0x22020000 -work-area-size 0x10000 -work-area-backup 1
#$_TARGETNAME.0 configure -rtos auto

echo "Ready for Remote Connections"

$_TARGETNAME.0 configure -event reset-assert-pre {
    echo "reset-assert-pre"
    adapter speed 100
}

$_TARGETNAME.0 configure -event reset-deassert-post {
    echo "reset-deassert-post"
    adapter speed 4000
    reg mstatus 0x7800
    reg mie 0x0
#    reg pc 0x22008000
}

$_TARGETNAME.0 configure -event reset-init {
    echo "reset-init"
# 4MHz for FPGA
    adapter speed 4000
}

gdb_memory_map enable
gdb_flash_program disable

riscv set_prefer_sba on
riscv set_command_timeout_sec 1

init
reset init

#jtag arp_init

#resume
#exit
In 702.init:
set architecture riscv:rv32
#target remote :3333
#set disassemble-next-line on
set mem inaccessible-by-default off
#gdb_breakpoint_override [hard|soft|disable]

mem 0x22008000 0x22014000 rw
mem 0x42008000 0x42014000 rw
mem 0x22014000 0x22020000 rw
mem 0x42014000 0x42020000 rw
mem 0x22020000 0x22030000 rw
mem 0x42020000 0x42030000 rw
mem 0x22030000 0x2204C000 rw
mem 0x42030000 0x4204C000 rw
mem 0x23000000 0x23400000 ro
Then run:
openocd -f ~/openocd-cfg/if_rv_dbg_plus.cfg -f ~/openocd-cfg/tgt_702.cfg
Hopefully you'll get the following message:
[riscv.cpu.0] Target successfully examined.
Now that openocd sucessfully connects to the target board, next step is to fire-up gdb:
~/bl_iot_sdk/toolchain/riscv/Linux/bin/riscv64-unknown-elf-gdb <path_to_project>/build_out/main.elf -x ~/openocd-cfg/702.init
Now you can finally attach a GDB session like this on the (gdb) prompt:
target extended-remote localhost:3333
Further, considering that the dev board uses external flash, there are two ways to debug on chip:
- debug code on ram
- pre-load code to xip as usual using serial, before starting the debug session.
More details can be found on the official pdf1. We will use the second method, on the (gdb) prompt:
set $pc = 0x21000000
set $mie = 0
set $mstatus = 0x1880
Now you can step throught the code and probe to your heart's liking. For example:
thb main
continue
continue
See more commands in the official pdf1. To learn more about GDB see here.
https://github.com/bouffalolab/bl_docs/blob/main/BL602_Openocd%26GDB/en/Introduction%20of%20OpenOCD%20and%20GDB.pdf
You can also use a typical ftdi232rl as a debugger probe for openocd as dicussed in this post. But due to conflicts on pins for UART and JTAG mode on the ftdi module, you'll need to setup two modules each for flashing (UART) and probing (JTAG).